How to Use Mind the Graph for Scientific Illustrations
Mind the Graph is an innovative app designed specifically for creating scientific illustrations. It’s an indispensable tool for science educators, researchers, medical students, and professionals seeking to convey complex information visually.
Getting Started with Mind the Graph
Creating professional scientific illustrations is just a few steps away with Mind the Graph. Here’s how you can get started:
Step 1: Sign Up
Visit mindthegraph.com and click on the “Start Now” button in the top-right corner to begin.
Step 2: Personalize Your Experience
Select your field and role to tailor the experience to your specific needs, then sign up to create your account.
Step 3: Choose Your Plan
Pick a subscription plan that fits your requirements, whether you’re an individual or part of an institution.

Step 4: Start Creating
In Mind the Graph, you can create a variety of visual content, including:
- Graphical Abstracts
- Presentation Slides
- Infographics
- Posters
Select the type of content you want to create from the dashboard.
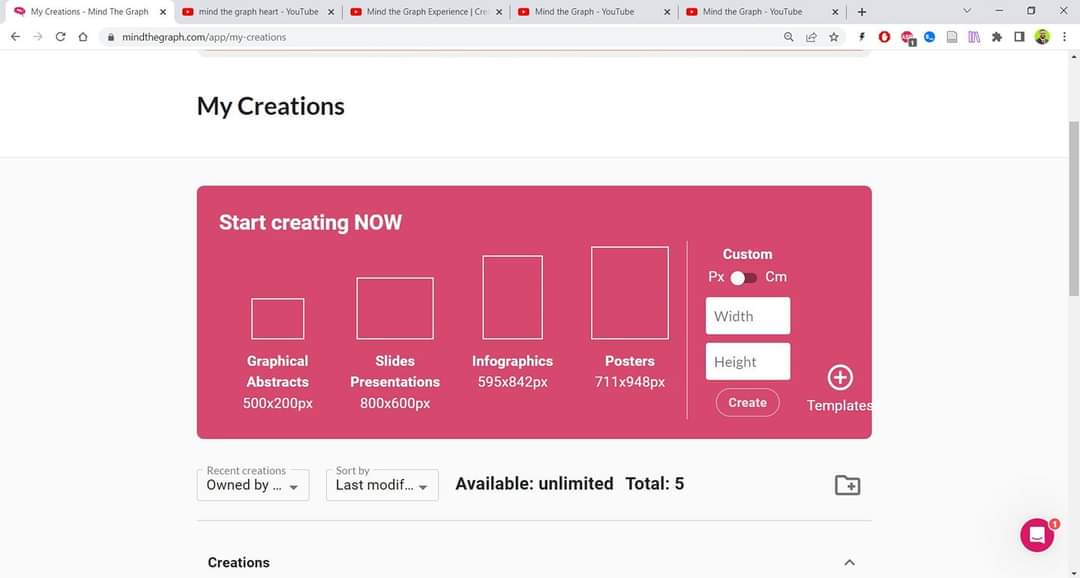
Step 5: Design Your Illustration
Use the intuitive sidebar to add illustrations, graphs, and text to your blank canvas, crafting your visual message.
Step 6: Choose from Templates
If starting from scratch isn’t your style, Mind the Graph offers various templates to jumpstart your design process.
Step 7: From the Templates
Here’s an example of how to create a graphical abstract with the help of Mind the Graph.
Step 8: Custom Illustrations
Can’t find what you’re looking for? Request custom illustrations, and the Mind the Graph team will create them for you, ensuring your scientific communication is precise and effective.
Why Mind the Graph?
Mind the Graph stands out as a specialized tool for the scientific community, offering features and content tailored to the unique needs of scientific communication. Its user-friendly interface, coupled with a vast library of scientific illustrations, makes it a go-to resource for anyone in the field of science and medicine. Whether you’re preparing for a conference, a class, or a publication, Mind the Graph helps you convey complex scientific ideas in visually appealing and understandable ways.
Try Mind the Graph today and transform the way you communicate science!


